Lesson 1: Principles of System Design
Before we begin getting into the minute details of programming or even the details of any programming language, we need to have a basic understanding of how computer systems operate and what the parameters are that we as a developer have control over when designing a project. In the case of this course, we will actually be tackling a more complex problem than designing and writing software, because of the use of a microcontroller, we will also be designing hardware components that interact with our software.
If you wish to follow along with the complete course you will need to purchase an Arduino kit of some kind. I highly recommend this one Amazon.com: ELEGOO: Arduino Starter Kit. You can purchase it from Amazon or contact me and I will be happy to supply you with a custom kit that has a few extra components that I found useful.
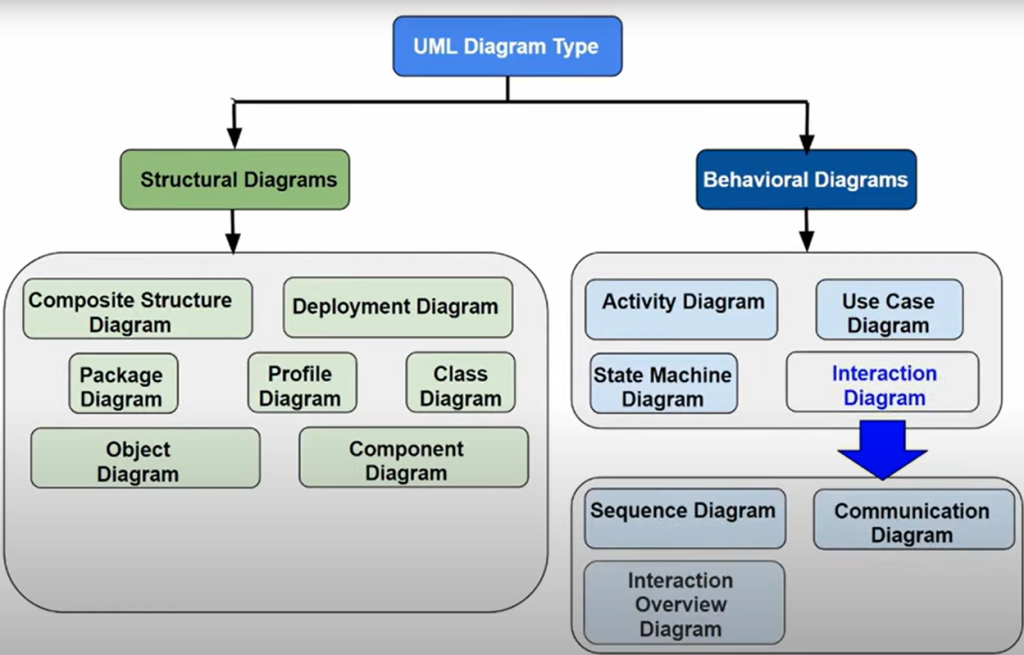
There is a standard for designing a software model calling UML or Universal Model Language, which we will give a very basic introduction to, but it takes a couple of years to make advanced UML diagrams, so we will keep it simple. If you want to learn more about UML there are several videos and books available. UML defines projects in two different ways, structurally, which defines the details of how the software code is organized and behaviorally, which defines how the software interacts with the user or environment. Our focus will be on the behavior of the system more so than the structure so I will cover it first. To me this is the more important of the two because we need to understand how we expect our system to behave before we can detail the design.
Behavioral Diagrams
Behavioral Diagram describe the behavior of a product, while UML is focused on software products, you can use the concepts of UML to describe physical products as well. In our case we will use it for both software and hardware designs. There are four main types of Behavioral Diagrams: Activity, Use Case, State Machine, and Interaction.
Activity Diagrams
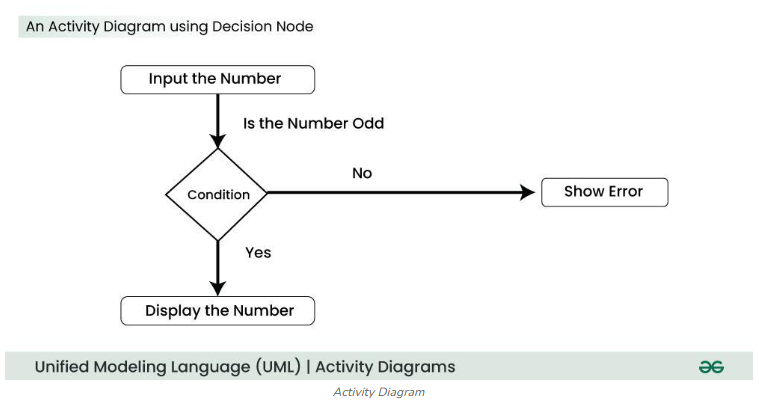
An Activity Diagram is a visual representation of workflows or processes within a system, commonly used in the Unified Modeling Language (UML). It illustrates the flow of control or data, showing how a system transitions between different states or activities. These diagrams are particularly useful for modeling dynamic behaviors, business processes, and use cases.
Activity diagrams are ideal for:
- Modeling workflows or business processes.
- Visualizing concurrent or parallel tasks.
- Simplifying complex decision-making processes.
- Describing the flow of control in use cases.
- Analyzing system behavior over time.
When I learned programming we used flow charts, which represented sequential operations. This was mainly because computers were simpler then and were really sequential in the way they worked. There was no good way to interact with more than one step at a time. As computers advanced it became important to track activities rather than flows because more than one activity can now impact the data on the system at the same time.
The steps needed to create an activity diagram are as follows:
- Identify the initial and final states of the process.
- List all intermediate activities and their sequence.
- Define conditions or constraints influencing transitions.
- Use appropriate UML notations to represent the flow.
Use Case Diagrams
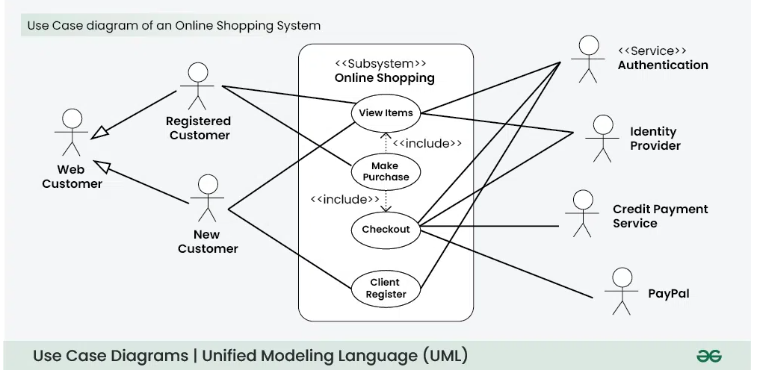
A UML Use Case Diagram is a visual representation of the interactions between users (actors) and a system. It captures the functional requirements of a system by illustrating how users engage with various functionalities (use cases). These diagrams are essential for understanding system behavior, defining scope, and gathering requirements. Actors can also be sensors or connected devices, not necessarily just users.
Use Case Diagrams are used to:
- Gather and clarify system requirements.
- Provide a high-level view of system functionality for stakeholders.
- Define system boundaries and interactions with external entities.
- Serve as a foundation for designing user interfaces and test cases.
Steps to Create a Use Case Diagram
- Identify the actors interacting with the system.
- Determine the use cases representing system functionalities.
- Connect actors to use cases using association lines.
- Define the system boundary to establish the scope.
- Add relationships like include, extend, or generalization where applicable.
- Review and refine the diagram for accuracy and clarity.
Best Practices
- Use clear and consistent naming for actors and use cases.
- Focus on core functionalities without overloading the diagram with details.
- Group related use cases for better organization.
- Regularly update the diagram to reflect system changes.
Limitations
While Use Case Diagrams are excellent for capturing high-level requirements, they do not describe how functionalities are implemented. They are best complemented with other UML diagrams like sequence or activity diagrams for detailed design.
State Machine Diagram
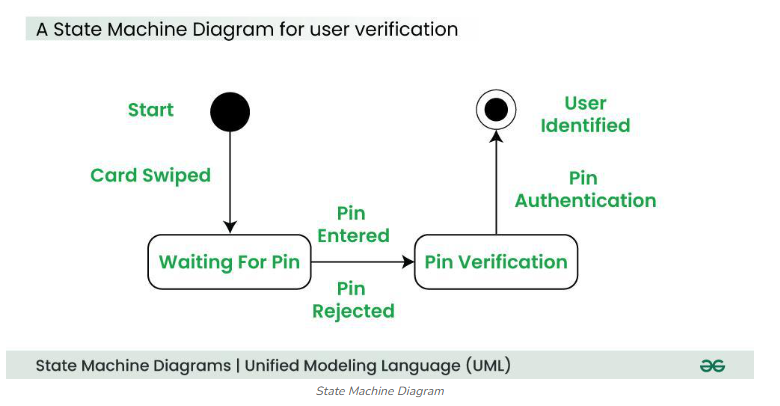
A State Machine Diagram is a UML behavioral diagram used to model the dynamic behavior of a system by showing its states and the transitions between them over time. It is particularly useful when an entity’s behavior depends not only on current inputs but also on its previous state. These diagrams are also called state diagrams or state charts and are widely used in software design, embedded systems, UI workflows, and game development.
Core idea: An object can respond differently to the same event depending on its current state. The diagram visually represents these states, the events that trigger transitions, and the actions performed during those transitions.
Key Components:
Composite State: A state containing nested substates for complex behaviors.
Initial State: Shown as a filled black circle; marks the starting point.
State: Represented by a rounded rectangle; describes a condition or situation of an object.
Transition: A solid arrow labeled with the triggering event; shows movement from one state to another.
Final State: Depicted as a filled circle within another circle; marks the end of the lifecycle.
Fork/Join: Used for concurrent states.
Self-transition: Arrow looping back to the same state.
Applications:
- UI Design: Model screen transitions based on user actions.
- Embedded Systems: Represent control logic between hardware and software.
- Game Development: Define character or object behavior changes.
- Business Processes: Show workflow states and decision-driven transitions.
By clearly mapping states, events, and transitions, state machine diagrams help in system analysis, design, and testing for complex, state-dependent behaviors.
Interaction Diagrams
In software engineering, interaction diagrams are UML tools used to model the dynamic behavior of a system by showing how objects or components communicate through message passing over time. They help visualize control flow, object collaboration, and sequence of events in a system, making them essential for requirements analysis, design, and documentation.
Types of Interaction Diagrams include:
- Sequence Diagrams – Focus on the time-ordered sequence of messages between lifelines.
- Collaboration (Communication) Diagrams – Emphasize the structural organization of objects and their links.
- Timing Diagrams – Highlight changes in object states over time.
- Interaction Overview Diagrams (IODs) – Provide a high-level view of multiple interactions and decision flows.
Key Notations in interaction diagrams:
- Lifeline – Represents an object’s existence during the interaction.
- Messages – Synchronous, asynchronous, return, create, destroy, found, or lost messages.
- Control Nodes – Initial, decision, fork/join, and final nodes for flow control.
- Interaction Use – References another interaction diagram.
- Fragments – Group related interactions (loops, alternatives, parallels).
Steps to Create an Interaction Diagram:
- Validate and refine – Ensure accuracy against requirements.
- Identify interactions – Determine the scenario and participating objects.
- Draw lifelines – Vertical dashed lines for each object/component
- Add messages – Arrows showing communication, labeled with message type.
- Include fragments – For loops, conditions, or parallel flows.
- Connect with control flow – Solid arrows for normal flow, dashed for exceptions.
- Add control nodes – For branching, concurrency, start/end points.
Benefits:
- Clarity – Simplifies complex system behavior.
- Communication – Improves stakeholder understanding.
- Design Support – Aids in architecture and flow optimization.
- Testing – Helps derive test cases from interaction flows.
Interaction Overview Diagram
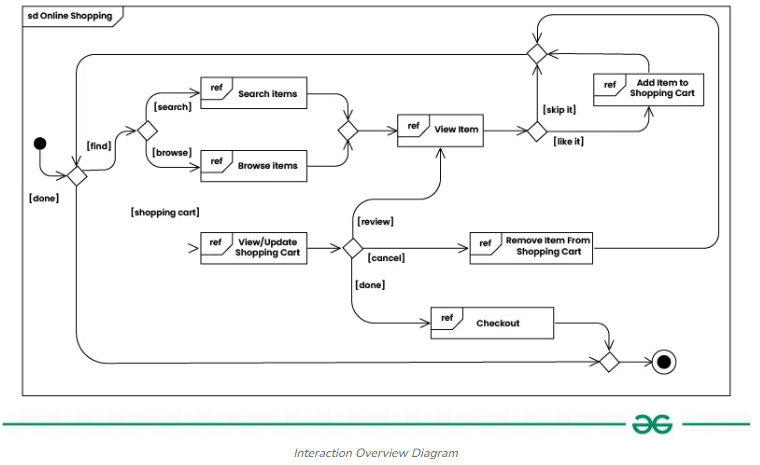
An Interaction Overview Diagram (IOD) is a type of UML (Unified Modeling Language) diagram that visualizes the flow of control and interactions between various components in a system. It helps stakeholders understand complex systems by providing a simplified view of how different parts interact to achieve specific goals. The diagram typically includes nodes representing interactions, decision points, and the flow of control between these elements.
Purpose and Benefits
- Clarity: Provides a clear visual representation of complex interactions, making it easier for stakeholders to understand system behavior.
- Simplification: Reduces cognitive load by abstracting detailed interactions into a higher-level overview.
- Documentation: Serves as a useful tool for requirements analysis, system design, and communication among team members. By using interaction overview diagrams, teams can effectively communicate the dynamics of their systems and ensure that all stakeholders have a shared understanding of how components interact. For more detailed examples and explanations, you can refer to resources like GeeksforGeeks and Visual Paradigm.
Sequence Diagram
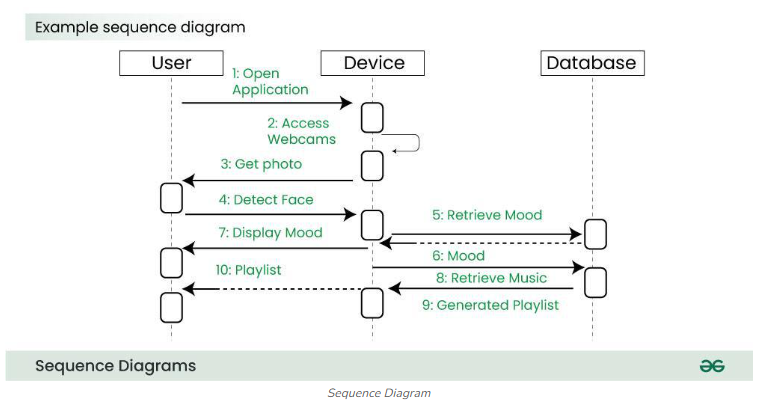
A sequence diagram simply depicts interaction between objects in a sequential order i.e. the order in which these interactions take place. These diagrams are widely used by businessmen and software developers to document and understand requirements for new and existing systems. We can also use the terms event diagrams or event scenarios to refer to a sequence diagram. Sequence diagrams describe how and in what order the objects in a system function.
Communication Diagram
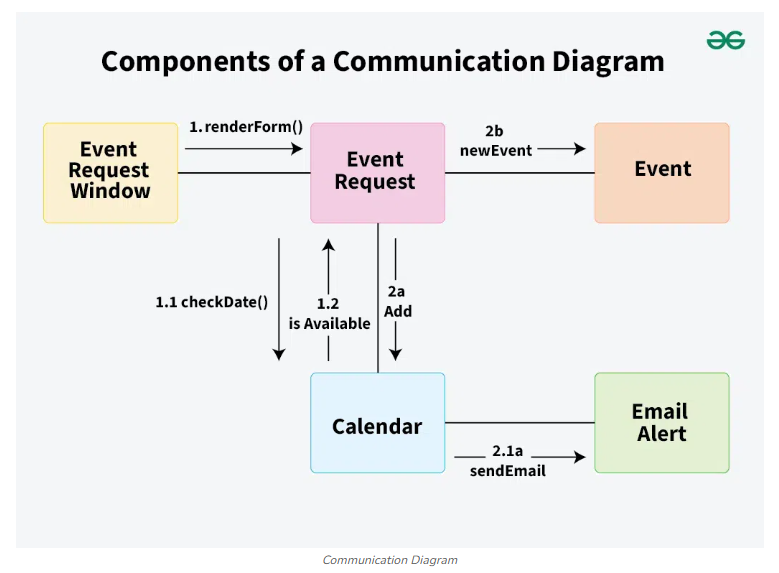
A Communication Diagram (known as Collaboration Diagram in UML 1.x) is used to show sequenced messages exchanged between objects. We can represent similar information using Sequence diagrams; however communication diagrams represent objects and links in a free form. A communication diagram focuses primarily on objects and their relationships.
Timing Diagram
Timing Diagram are a special form of Sequence diagrams which are used to depict the behavior of objects over a time frame. We use them to show time and duration constraints which govern changes in states and behavior of objects.
Structural Diagrams
Structural UML diagrams are visual representations that depict the static aspects of a system, including its classes, objects, components, and their relationships, providing a clear view of the system’s architecture.
Composite Structure Diagram
We use composite structure diagrams to represent the internal structure of a class and its interaction points with other parts of the system.
- A composite structure diagram represents relationship between parts and their configuration which determine how the classifier (class, a component, or a deployment node) behaves.
- They represent internal structure of a structured classifier making the use of parts, ports, and connectors.
- We can also model collaborations using composite structure diagrams.
- They are similar to class diagrams except they represent individual parts in detail as compared to the entire class.
Deployment Diagram
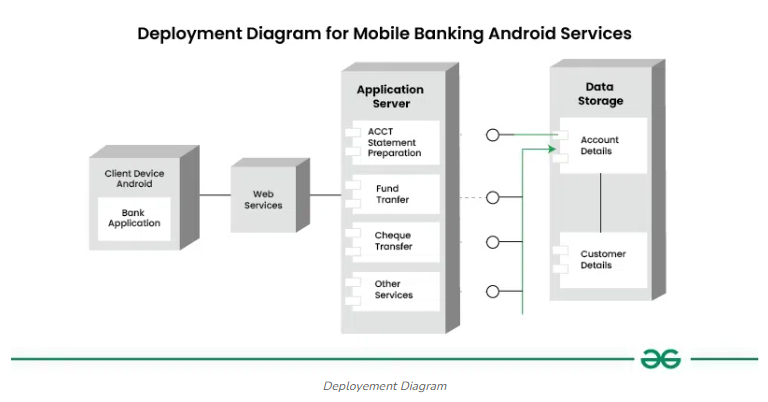
Deployment Diagrams are used to represent system hardware and its software. It tells us what hardware components exist and what software components run on them.
- We illustrate system architecture as distribution of software artifacts over distributed targets.
- An artifact is the information that is generated by system software.
- They are primarily used when a software is being used, distributed or deployed over multiple machines with different configurations.
Package Diagram
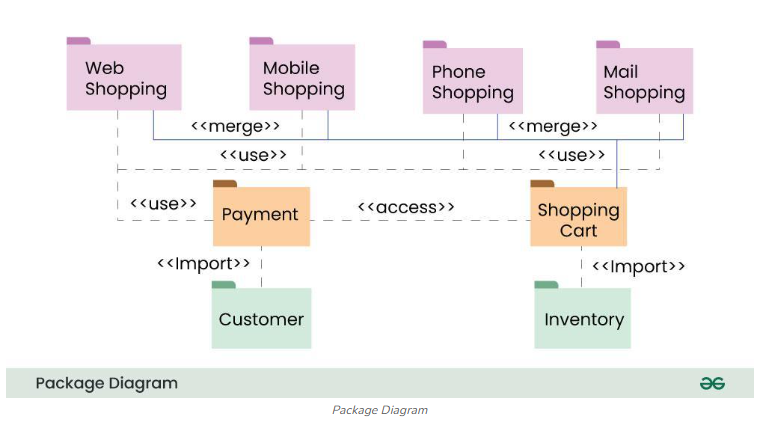
We use Package Diagrams to depict how packages and their elements have been organized. A package diagram simply shows us the dependencies between different packages and internal composition of packages.
- Packages help us to organise UML diagrams into meaningful groups and make the diagram easy to understand.
- They are primarily used to organise class and use case diagrams.
Profile Diagram
Descripton
Class Diagram
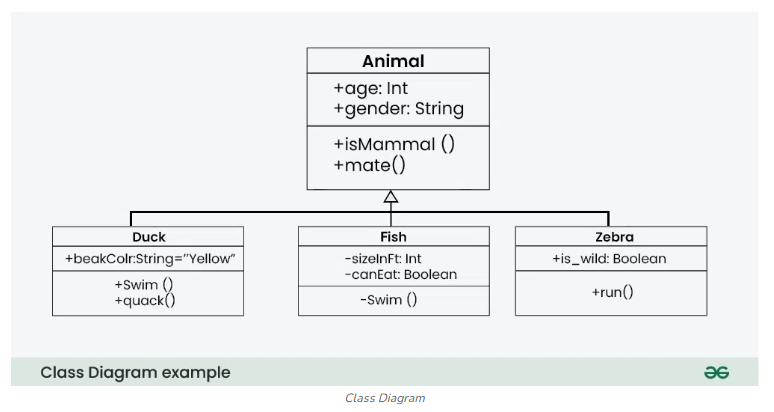
The most widely use UML diagram is the class diagram. It is the building block of all object oriented software systems. We use class diagrams to depict the static structure of a system by showing system’s classes, their methods and attributes. Class diagrams also help us identify relationship between different classes or objects.
Object Diagram
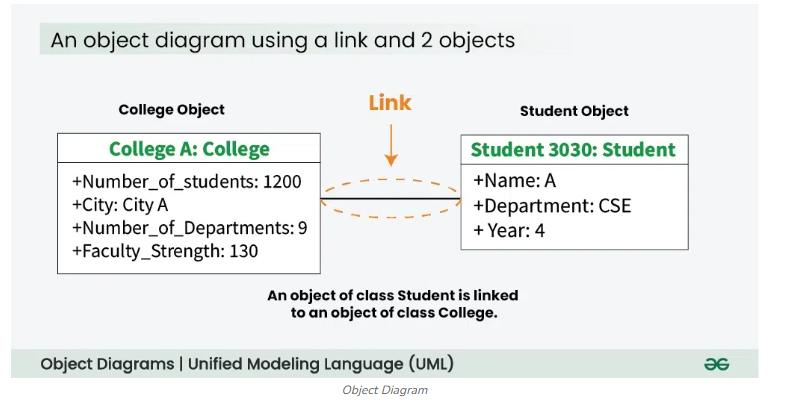
An Object Diagram can be referred to as a screenshot of the instances in a system and the relationship that exists between them. Since object diagrams depict behaviour when objects have been instantiated, we are able to study the behaviour of the system at a particular instant.
- An object diagram is similar to a class diagram except it shows the instances of classes in the system.
- We depict actual classifiers and their relationships making the use of class diagrams.
- On the other hand, an Object Diagram represents specific instances of classes and relationships between them at a point of time.
Component Diagrams
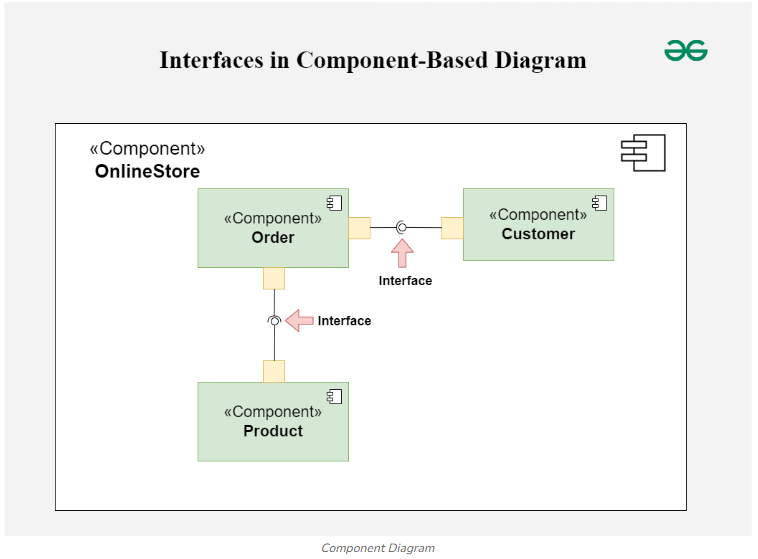
Component diagrams are used to represent how the physical components in a system have been organized. We use them for modelling implementation details.
- Component Diagrams depict the structural relationship between software system elements and help us in understanding if functional requirements have been covered by planned development.
- Component Diagrams become essential to use when we design and build complex systems.
- Interfaces are used by components of the system to communicate with each other.
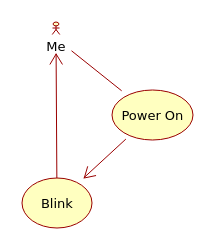
Example in Class of the “Blink” example for the Ardunio
We discussed that there was a single “actor” the user plugging in power to the Ardunio and expecting the outcome of a blinking light. This resulted in the following Use Case Model
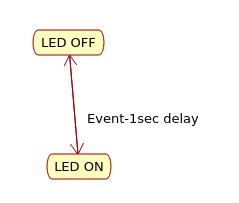
We discussed that in order for the light to blink it needs to have two states (ON and OFF) and a delay, resulting in this State Diagram
We then discussed how the Ardunio must work in order to achieve the blinking light. Resulting in the following behavior diagram.
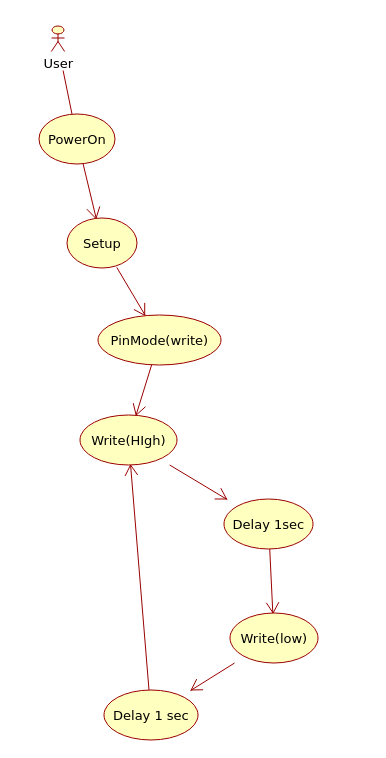
We did not discuss the class diagrams which shows how the underlying code works, but we did put Psuedo Code for the operations on the board.
void Setup() {
  pinMode(LED_BUILTIN, OUTPUT);
}

void loop() {
  digitalWrite(LED_BUILTIN, HIGH);
  delay(1000);
  digitalWrite(LED_BUILTIN, LOW);
  delay(1000);
}